Independent creators
Indie describes how a game is made, rather than a genre.
A game can be both indie and action, adventure or simulation. I separated the indie tag from genre when comparing the catalogue. These charts count games, not players or sales.
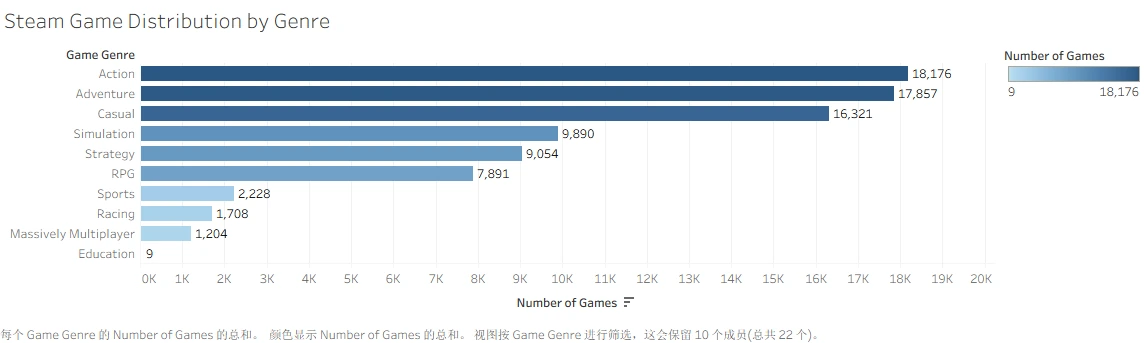
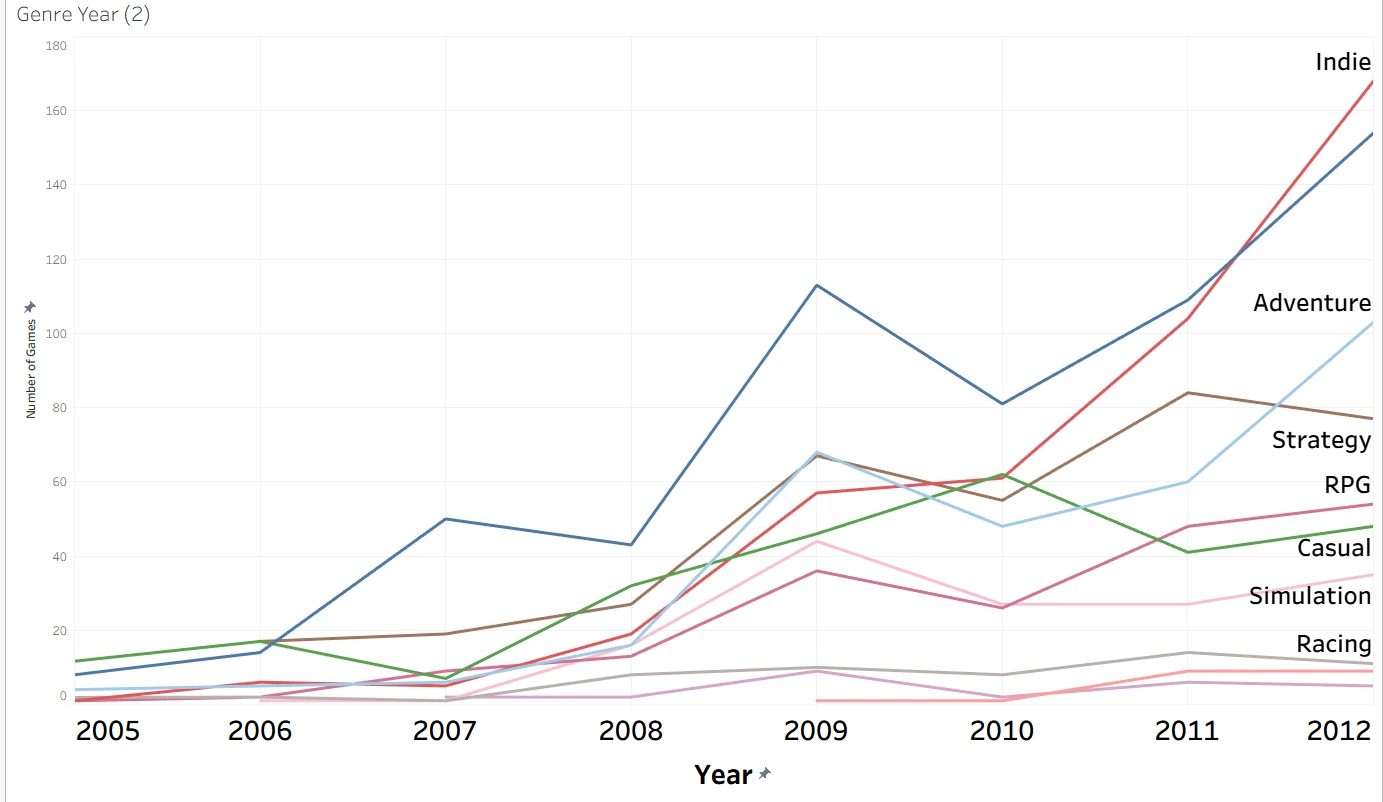
The rise of indie games reminded me of what happened to publishing, photography and video. Work that once needed a large organization could increasingly be made by one person or a small team. I see this as a change in who gets to express themselves through games, rather than simply another category becoming popular.
The release counts describe the supply of games, rather than their audience or sales.
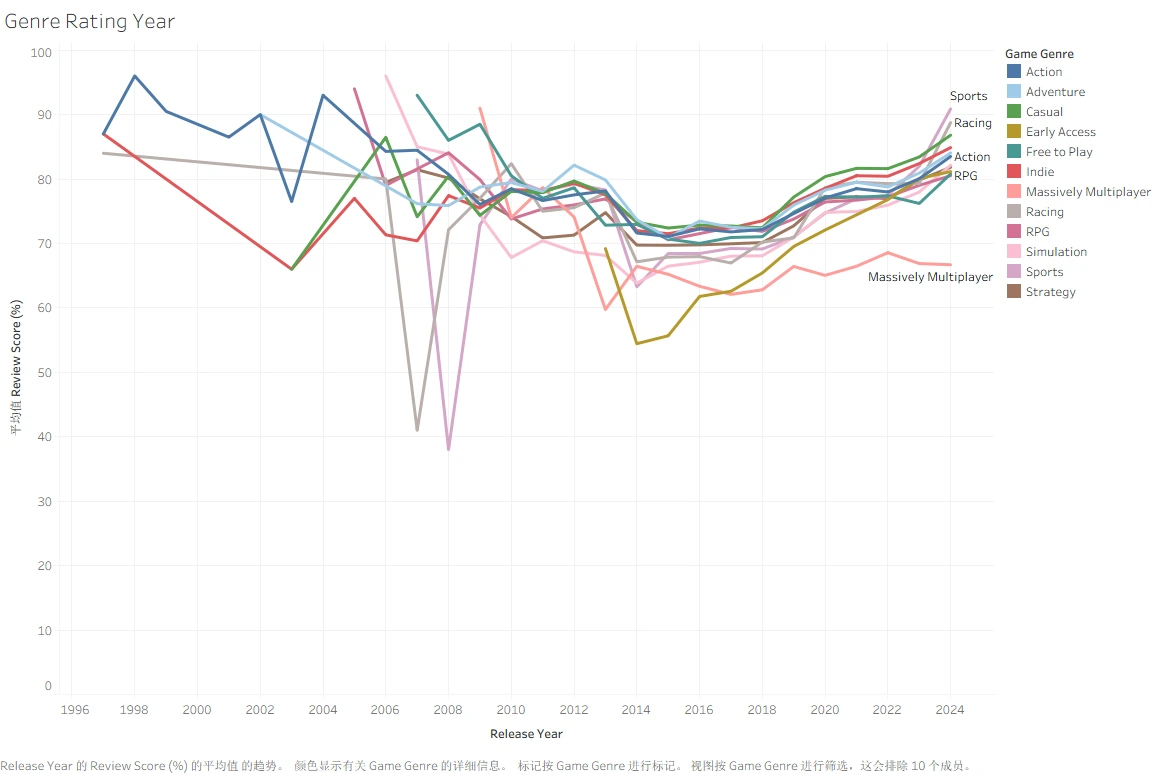
I also compared mean review scores. Casual games scored 12.86 points above massively multiplayer games, and indie games 11.85 points above them, with reported p-values below 0.001. These comparisons describe the groups in this dataset; they do not establish that a smaller team makes a better game.
Price and player ratings
A higher price does not consistently correspond to a higher review score.
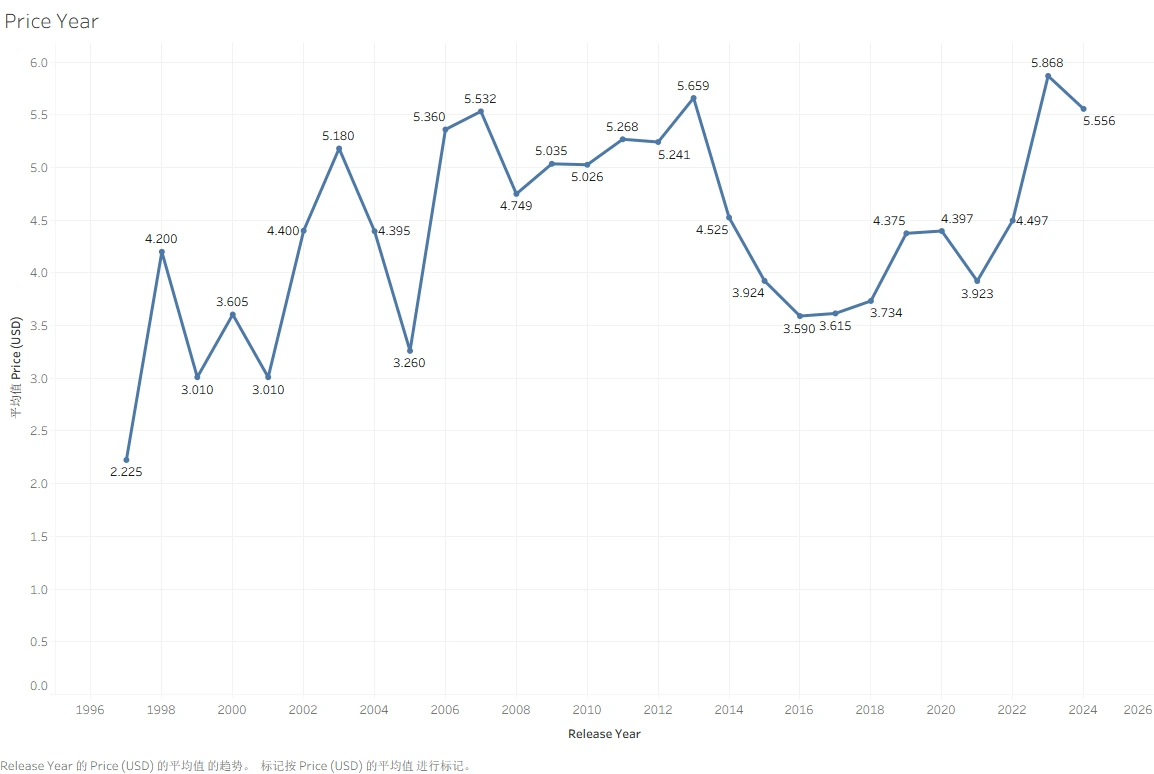
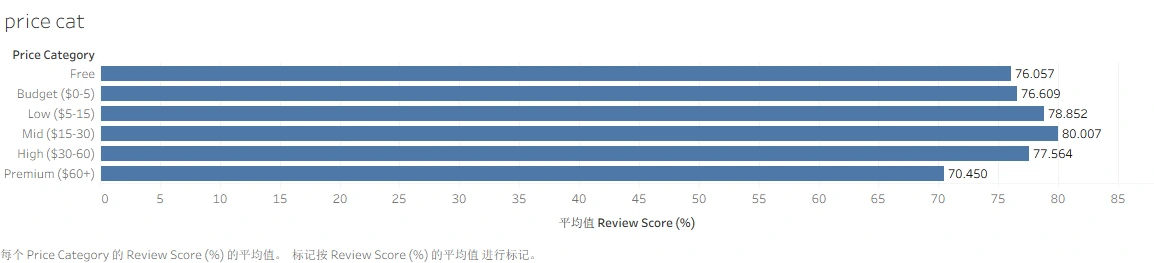
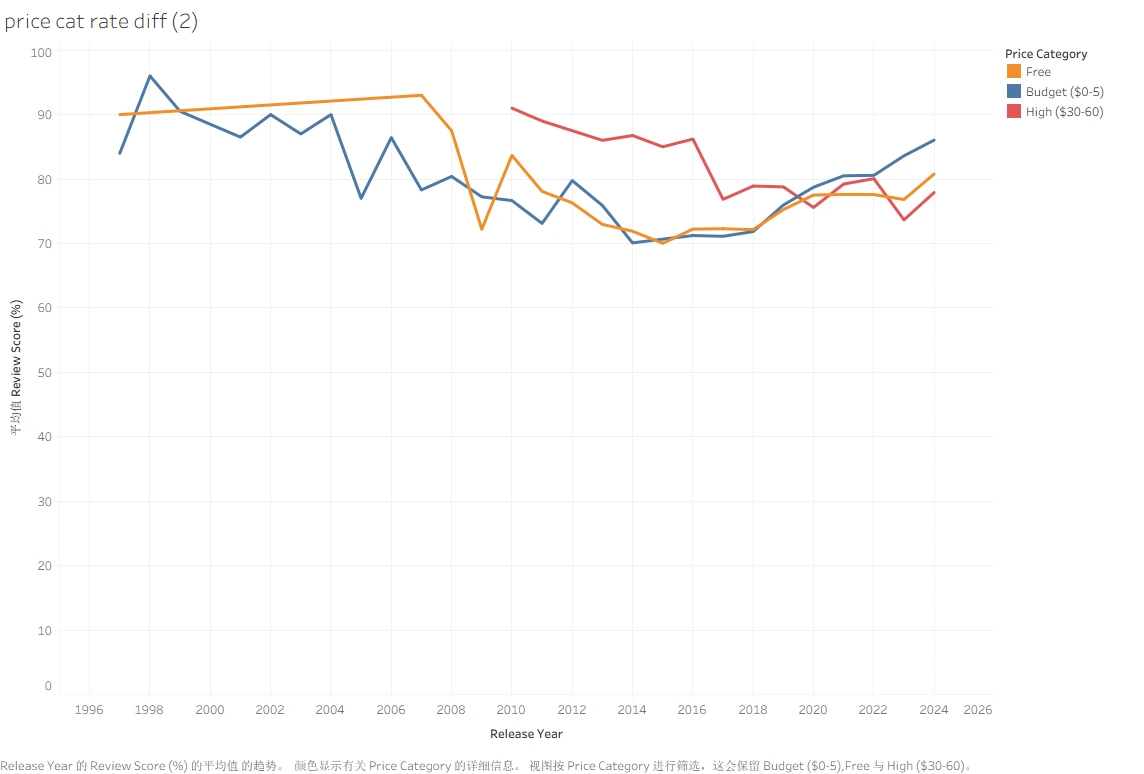
In the talk, I suggested that players might expect more from an expensive game, which could affect their ratings. That is a possible explanation, not something the charts test. The price-by-release-year chart also is not a history of what the same games cost at launch, and it does not by itself support an inflation-adjusted price comparison.
VR games
More VR releases, higher average prices and lower average ratings in this dataset.
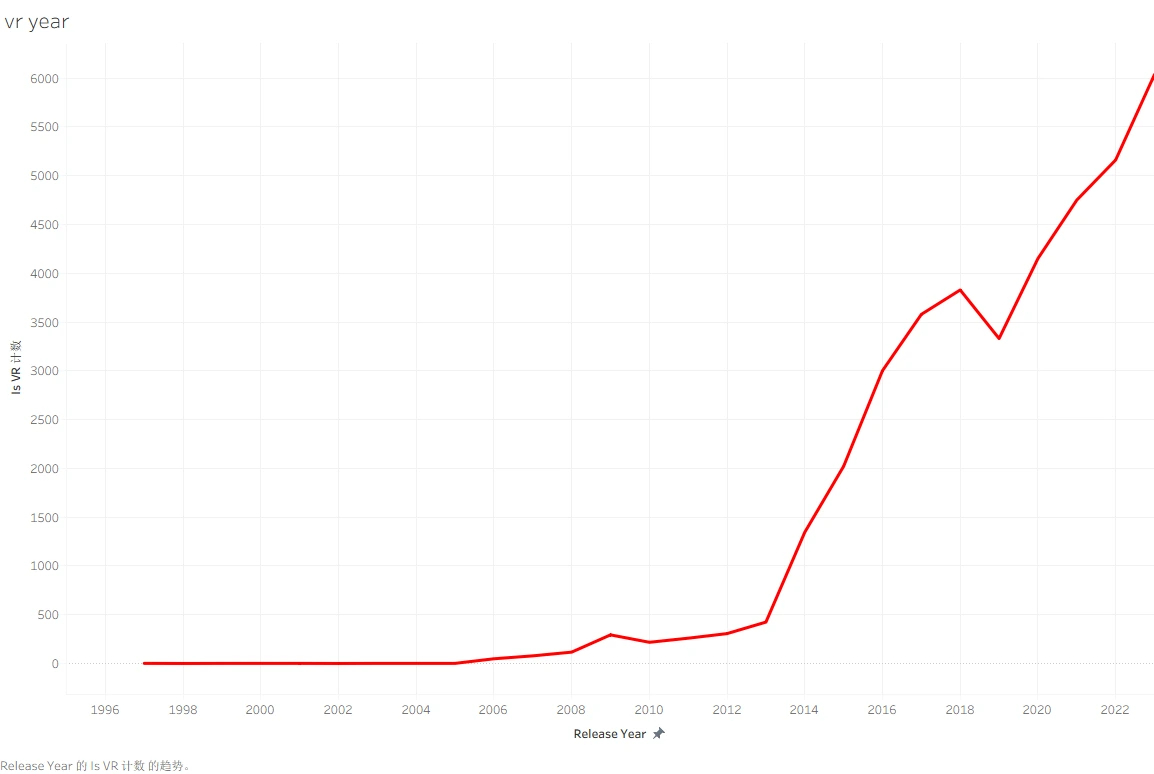


I was skeptical that the higher price of VR games was reflected in the experience players reported. It also made me question how much of the discussion about the future of games should focus on new hardware. The growth of independent development seemed more consequential to me.
Language and access
Who can understand a game is part of who can experience it.
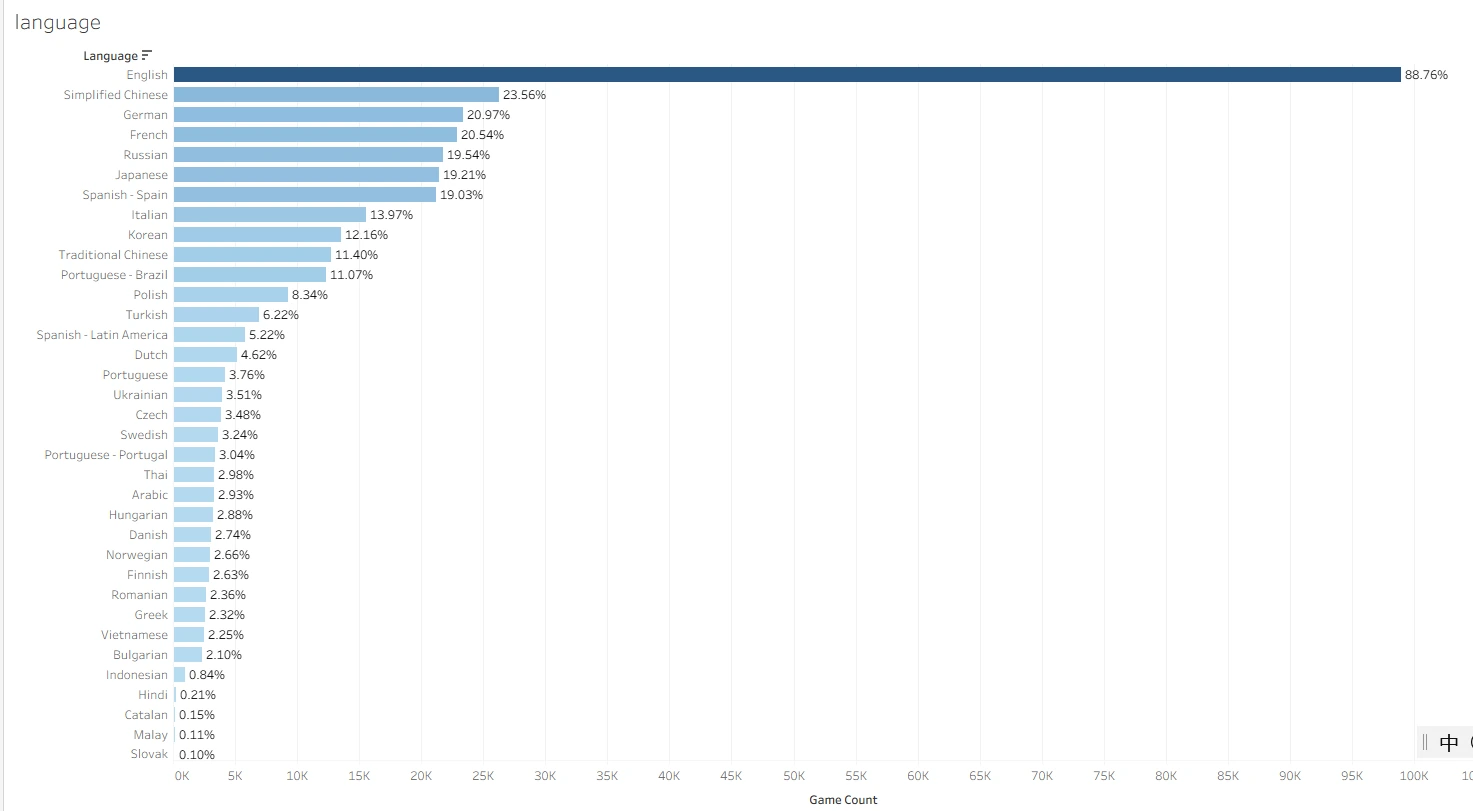
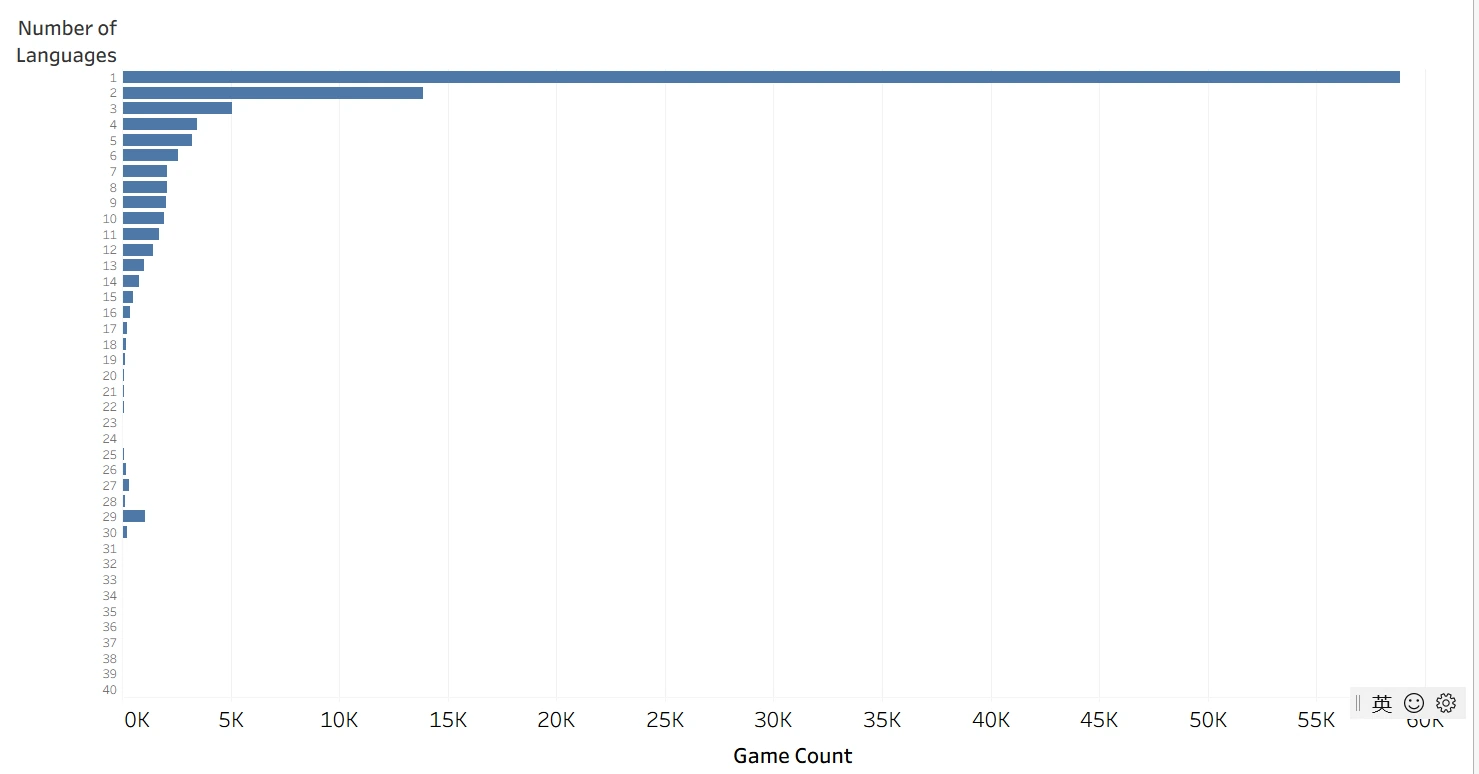
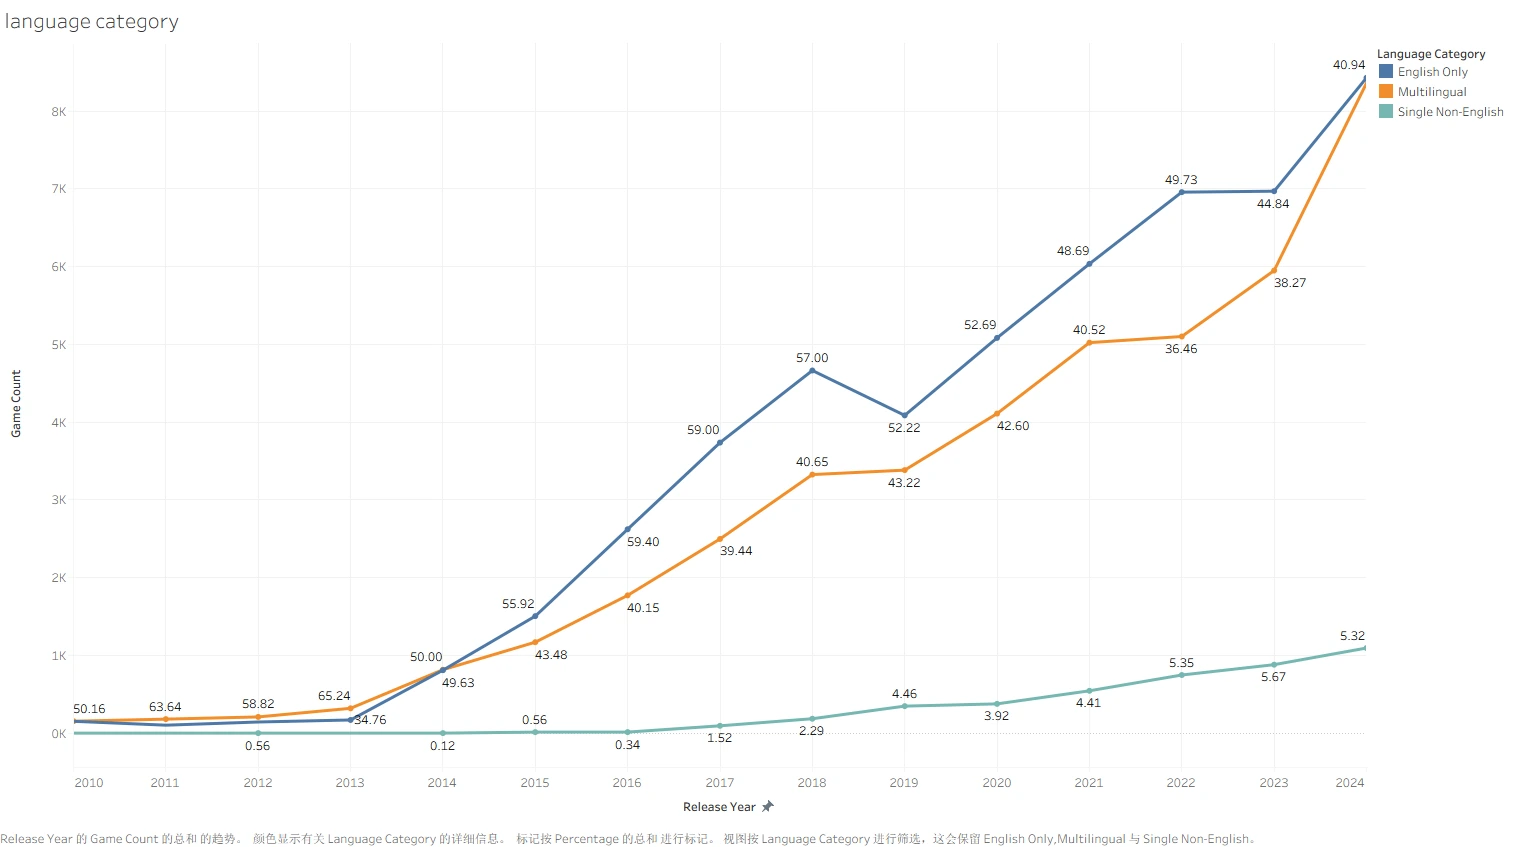
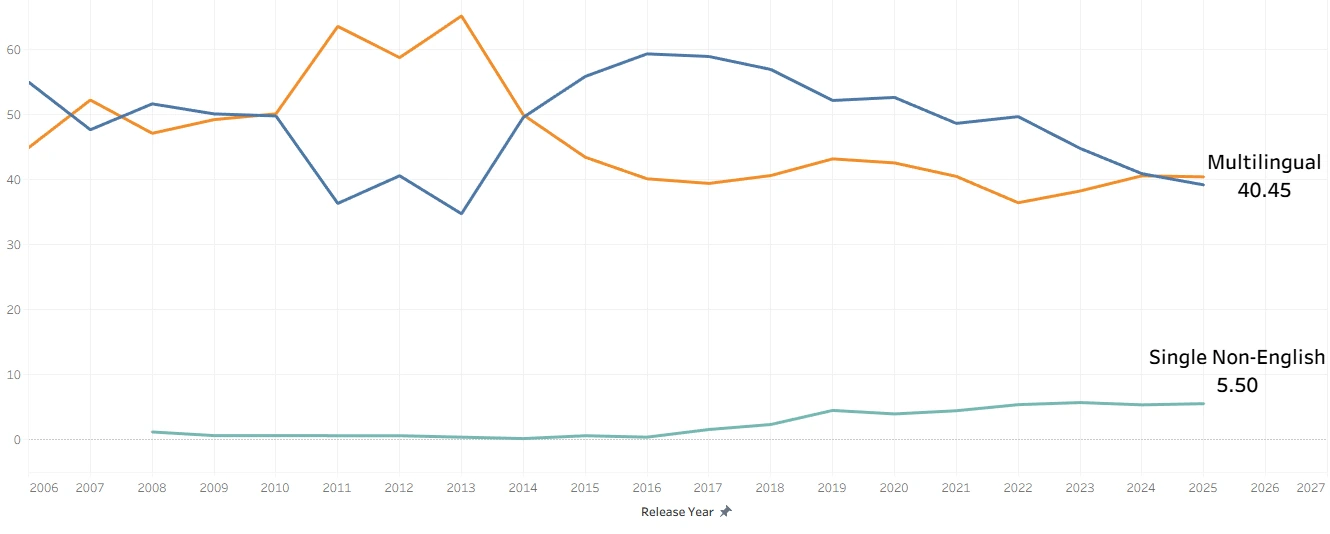
I then separated indie and non-indie games to look at the rise in English-only releases around 2014. The increase was especially visible in indie releases. The non-indie comparison followed a different pattern. The count and proportion charts help separate these changes.
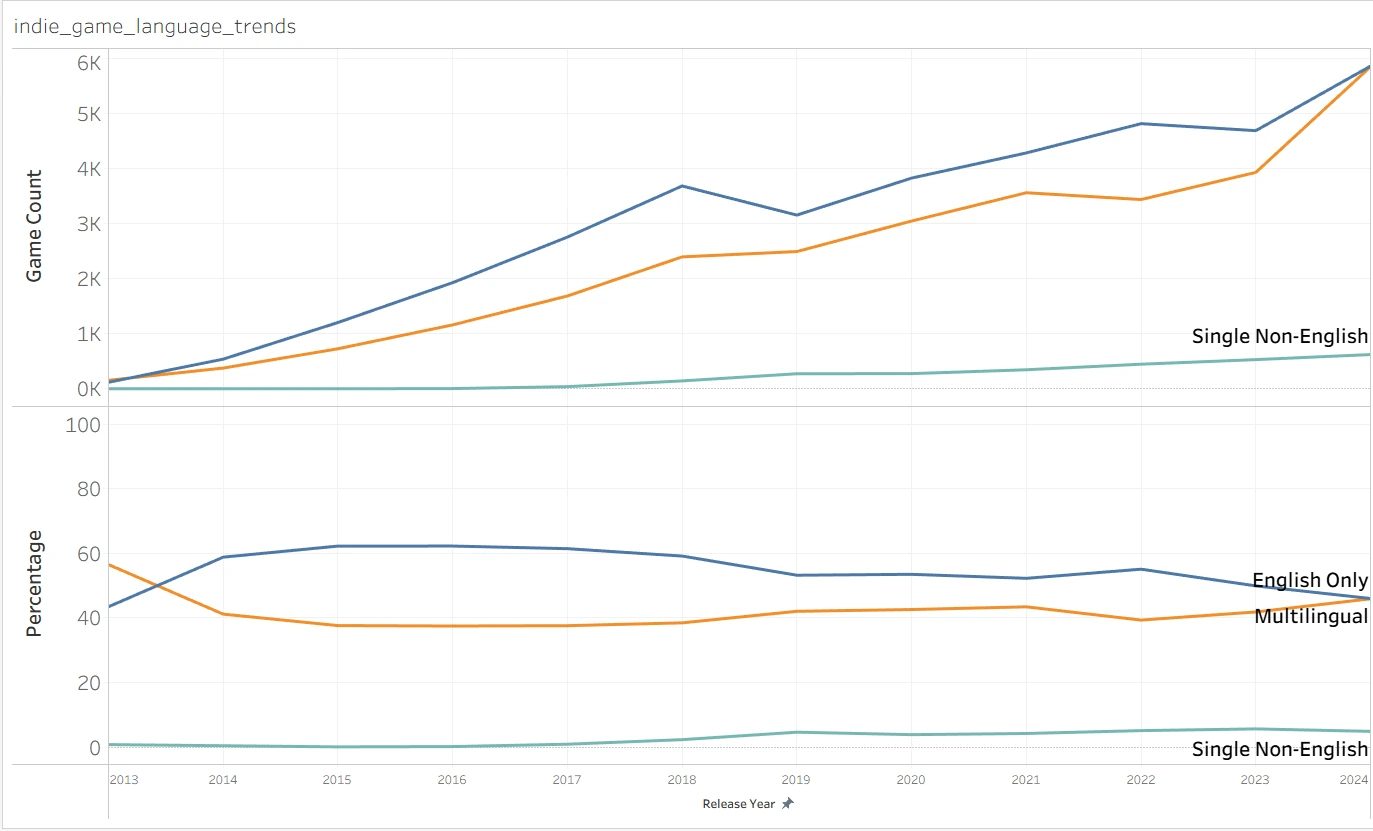
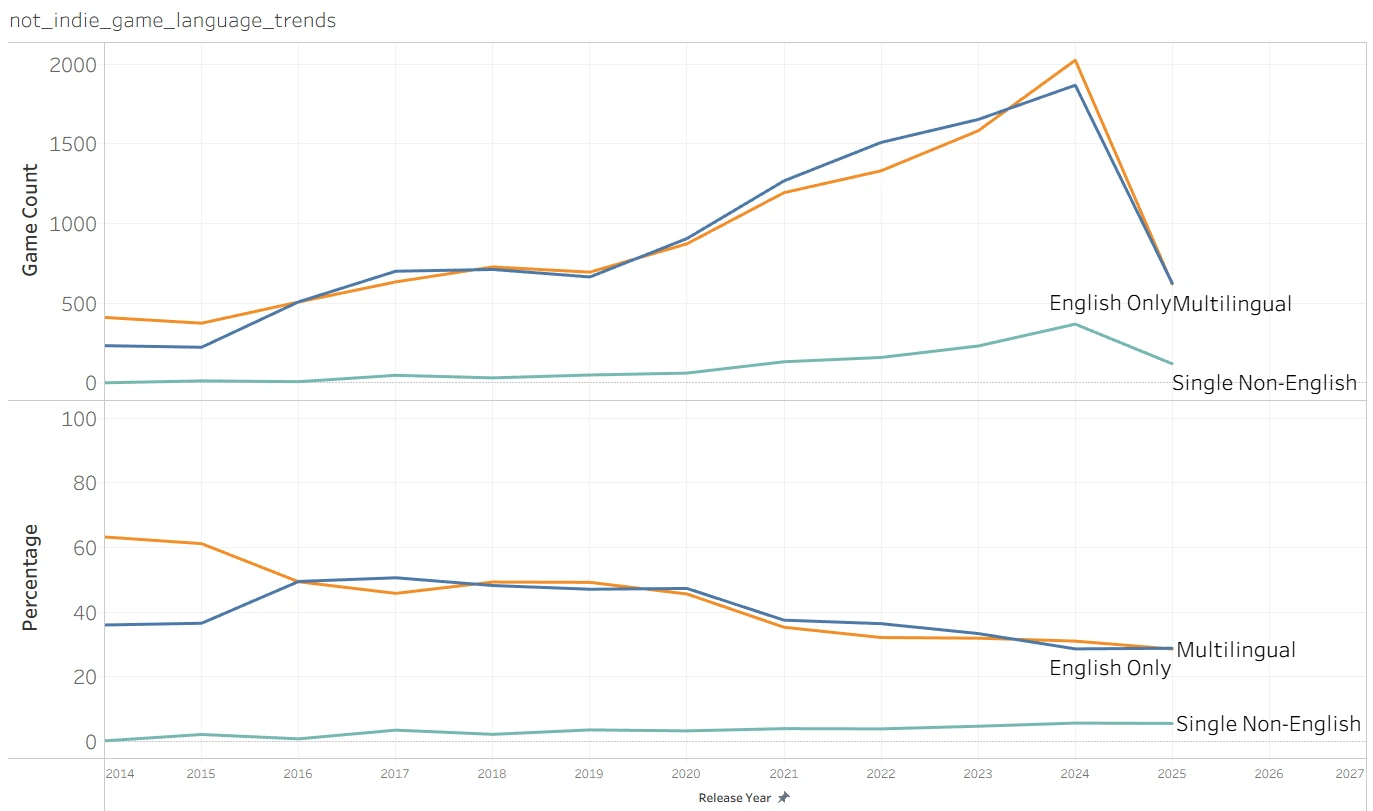
Translation takes work, and in the talk I speculated about developers balancing that work against reaching more players. The dataset does not include translation budgets or developer intentions. My conclusion was about access: more language support gives more people a chance to understand what a developer wants to say.
Why this matters to me
When I came to the United States, video games were one of the main ways I made friends with Americans. Games gave us something to do together even when we came from different backgrounds.
I think of games as an art form. They carry what their creators want to say, and players take part through interaction. Independent development gives more people a way to make that work. Supporting more languages gives more people a way to experience it.
I am happy to see more games supporting multiple languages. I want more people to be able to understand them and play together.